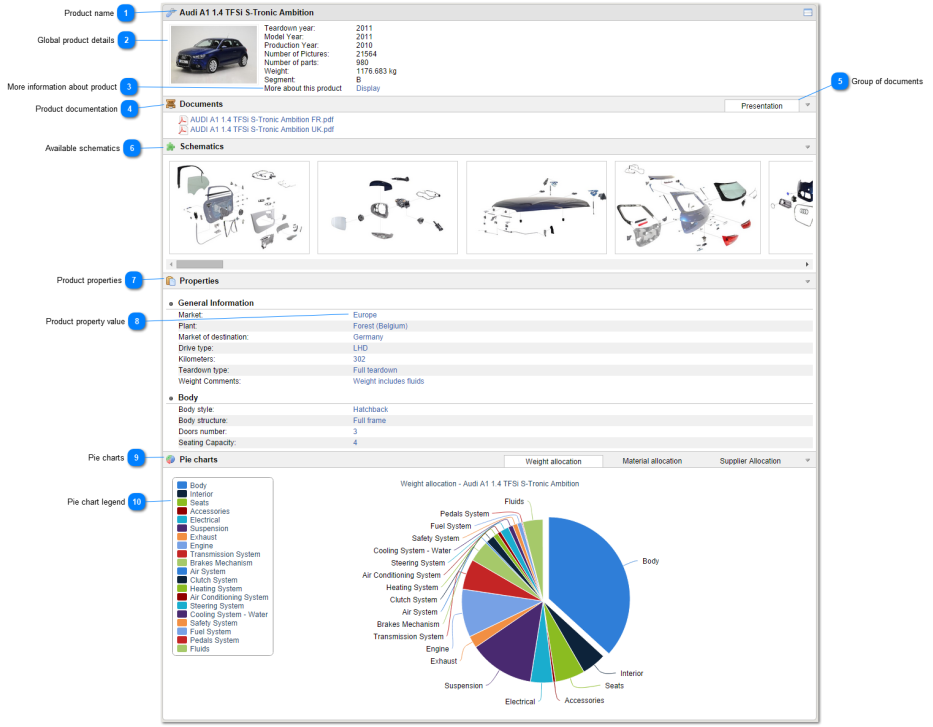
The Product Sheet is the default page when picking a product from the list.
Product name
The current product name : brand and model.
When the product name is in red, it's a mapped product.
The product name is followed by a red "(
In Process )" message if the teardown is not finished yet.
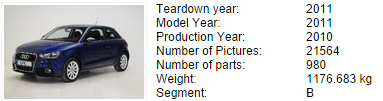
Global product details
The product picture, teardown year, model year, production year, number of pictures, number of parts, weight and segment are displayed on top of product sheet.
Note that years and segment information are shown only if set.
If set by administrator, an additional product picture can be displayed next to the current one. The second picture is from an already input picture on a hierarchy element.
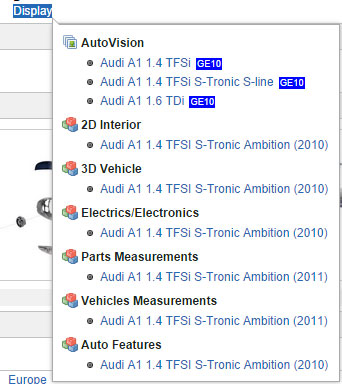
More information about product
When current product is available in other studies or teardown programs, a "Display" link opens a popup with links to related studies :
Product documentation
The list of available documentation is available here.
Right click and choose "save as" to download files.
Group of documents
Product documentation are stored inside document groups.
Those groups are displayed as tabs, click on a tab to see attached documentation in #4.
Available schematics
If there are schematics in current product, shortcuts are displayed here.
A schematic is an exploded view of a
system , where each contained parts links to the
Part Sheet .
Product properties
Product properties are listed here, grouped by property groups.
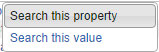
Product property value
Clicking on a property value will popup a menu to interact with
Search :
"Search this property" will add related product property as a search criteria.
"Search this value" will search for other data having with this value.
Pie charts
Three pie charts are available to describe product data, using tabs :
Weight allocation : weight repartition for each level 1 tree element
Material allocation : material repartition by weight
Supplier allocation : supplier repartition by count
Pie chart legend
The pie chart is paginated when many information is available in the chart.
Each entry is clickable to be removed from the chart and refresh the allocation, it can be used as filter.