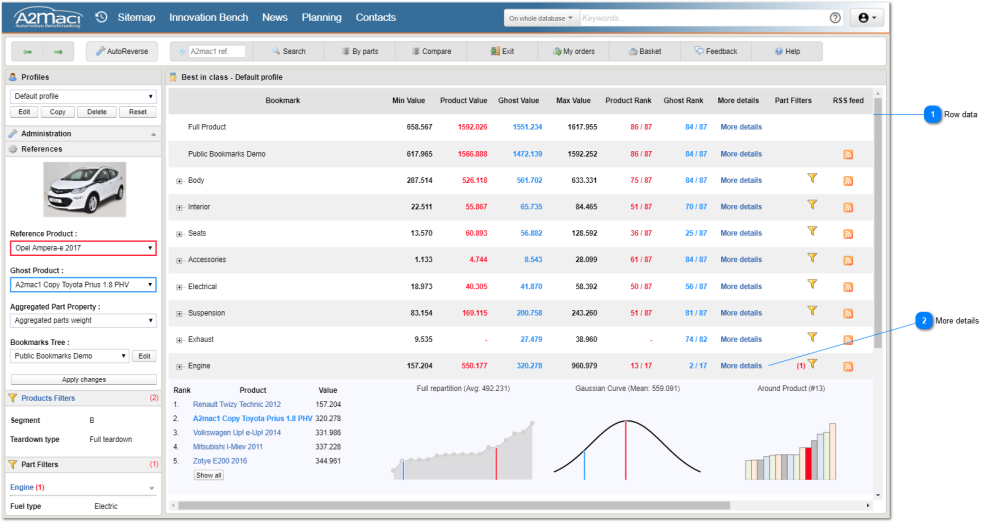
Data are separated in two major parts :
- Full Product, this line displays for information only, data of all product in the population unrestricted by your bookmarks tree,
- Bookmarks, these lines display for the complete tree and for each element the detailed data.
 Row data
A row is cut like :
- Bookmark Name,
- The minimum value in the population,
- The reference product value,
- The reference ghost product value,
- The maximum value in the population,
- The reference product rank against the population,
- The reference ghost product rank against the population,
- More details to get more information,
- Part filters to apply part specific filters,
- RSS Feed to subscribe on ranking changes. |
|
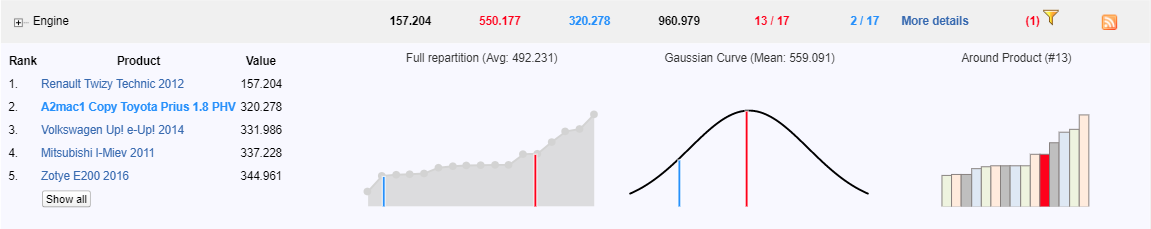
 More details
 section is cut like :
- Top 5 in the population ( to see all the ranking click on "Show all" )
- Values repartition chart, with average,
- Gaussian curve chart, with mean,
- Two charts, the surrounding products next to ghost or product reference
|
|